The Transformation Trap: Why 70% of Manufacturing Digitalization Projects Fail — and the Edge-First Architecture That Changes the Math
2026-08-04 10:29:00
云质变科技
Executive Summary
In a factory in Suzhou, a plant manager launches an AI-powered predictive maintenance pilot. The demo is impressive — the model predicts a bearing failure two weeks before it happens. The steering committee approves a $2 million expansion. Eighteen months later, the project is quietly shelved. The model never made it past the single pilot line. The data scientist who built it has left. The integration cost was three times the estimate. And the plant manager, now skeptical of all "digital transformation" initiatives, has reverted to the preventive maintenance schedule he's used for fifteen years.
This story is not exceptional. It is the norm.
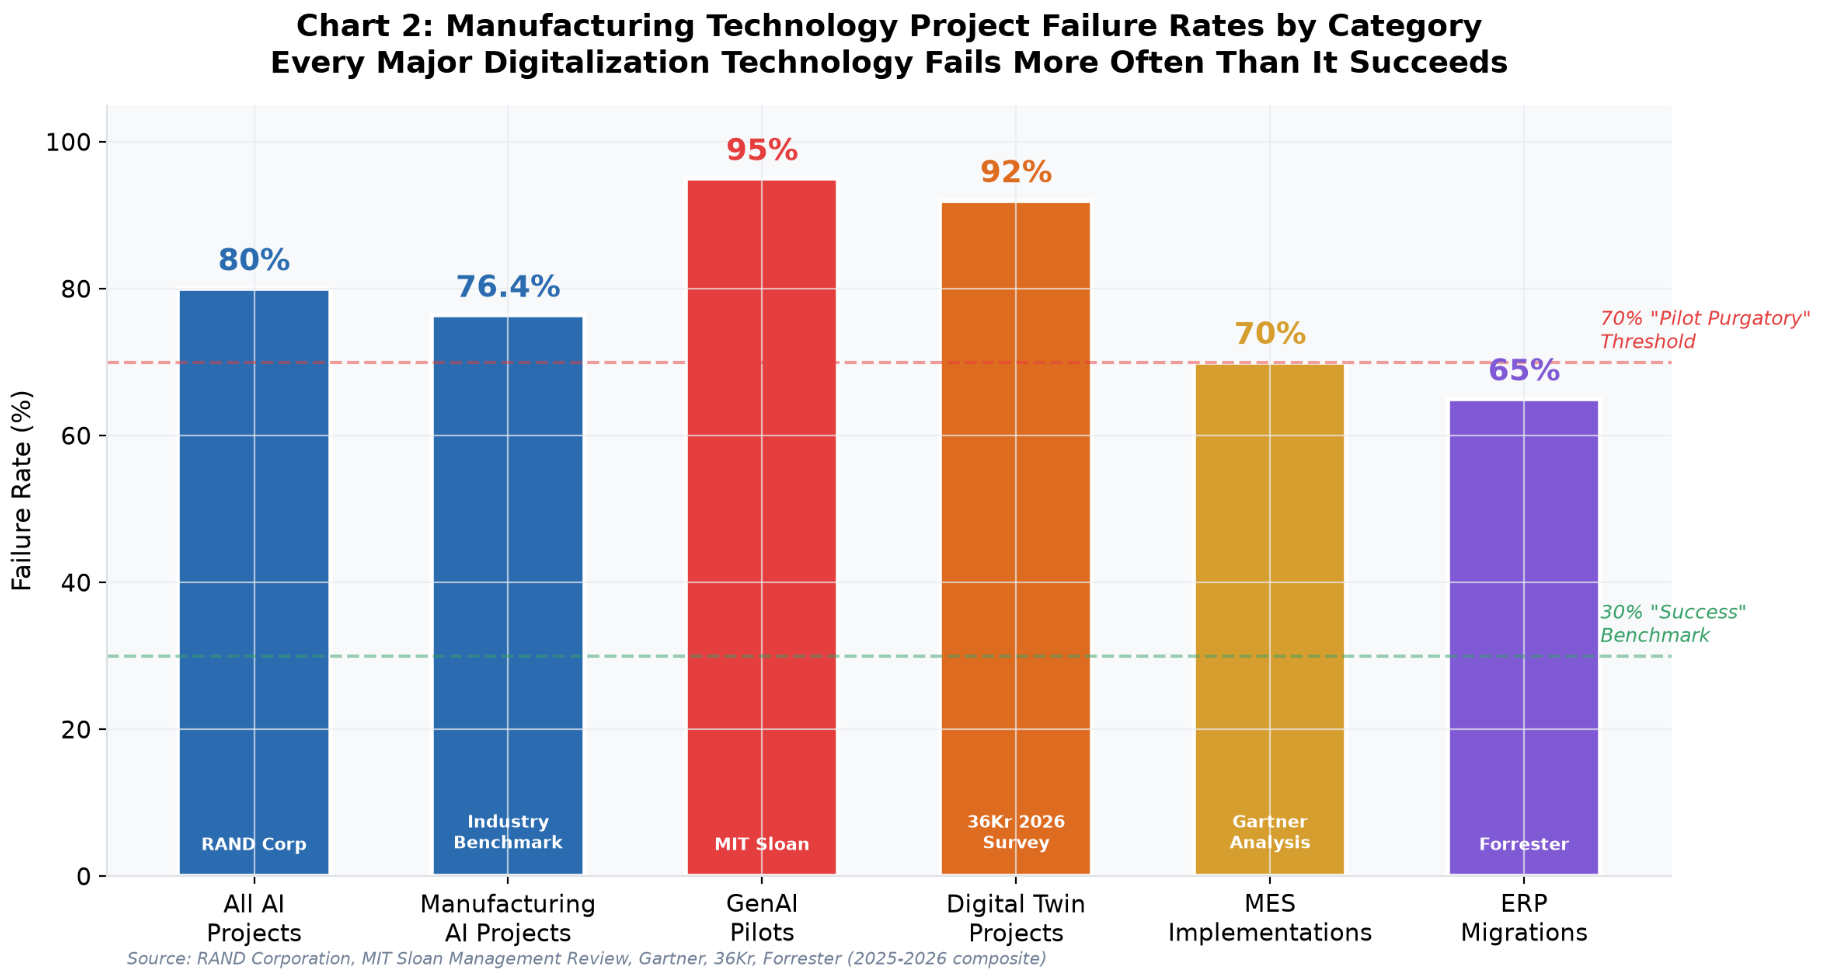
The data is unequivocal: 80% of AI projects fail to deliver business value (RAND Corporation). In manufacturing specifically, the failure rate is 76.4% (Industry Benchmark, 2026). For Generative AI pilots, the abandonment rate reaches 95% (MIT Sloan). Digital twin projects? 92% stall in development (36Kr 2026 Survey). Even traditional MES implementations — the workhorse of factory digitization — fail at a rate of 65-70% (Gartner).
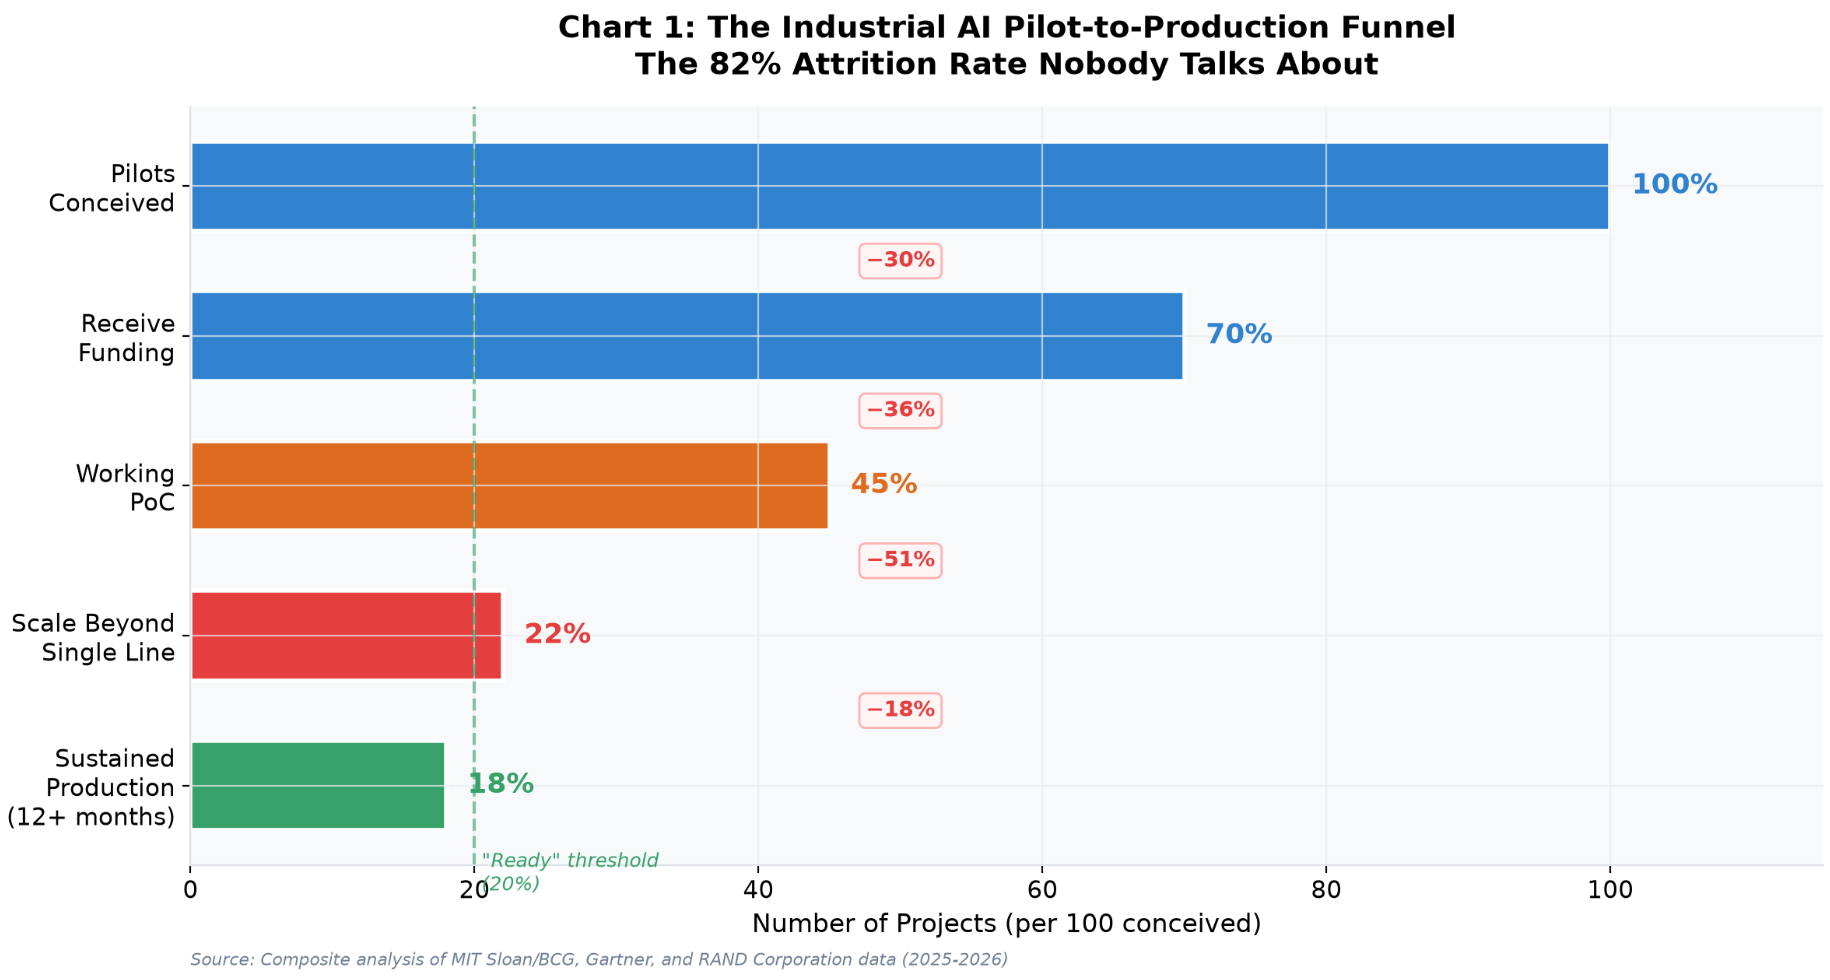
The composite picture is a brutal funnel: of every 100 digital transformation pilots conceived, roughly 70 receive funding, 45 produce a working proof of concept, only 22 scale beyond a single line or site, and just 15-26 enter what can honestly be called "sustained production." That is an 82% attrition rate from conception to production — and the rate has barely improved despite a wave of new tooling, foundation models, and "AI-ready" platform marketing.
Meanwhile, 98% of manufacturers are exploring or investing in AI-driven automation — but only 20% say they are actually prepared to operationalize it at scale (Redwood Software / Leger, 2026). This 78-point gap between exploration and readiness is where fortunes will be made and lost over the next three years.
This white paper argues that the manufacturing digitalization failure rate is not a technology problem. It is an architecture problem. The dominant approach — cloud-first, pilot-first, model-first — systematically misallocates resources, underinvests in data foundations, and creates integration debt that compounds until the project collapses under its own weight. The failure is not random; it is structural, predictable, and — most importantly — avoidable.
Drawing on Yunzhibian's proprietary database of 257+ manufacturing digitalization project post-mortems from the Yangtze River Delta — the world's densest manufacturing corridor — this paper provides the first architecture-level diagnosis of why manufacturing digitalization fails, and a practical alternative: the edge-first architecture that changes the economics of digital transformation.
Central argument: The failure is architectural, not technological. The dominant cloud-first, pilot-first, model-first approach systematically misallocates resources, underinvests in data foundations, and creates integration debt that compounds until projects collapse. Edge-first architecture — processing data where it's generated, investing in data foundations before AI, and scaling one line at a time — changes the economics: 35-40% lower cost, 4-8 months faster breakeven, and 2-3x higher success rates.
The Yunzhibian data advantage: This analysis is built on 257+ manufacturing digitalization project post-mortems, 142 industrial software evaluations, 38+ chip substitution guides, and 144 verification solution SKUs — all from direct factory-floor experience in the Yangtze River Delta, the world's densest manufacturing corridor. No other published analysis matches this depth of field-validated, component-level manufacturing digitalization data.
Key Findings:
表格
| Finding | Detail |
|---|---|
| Overall manufacturing digitalization failure rate | 70-80% (composite of AI, MES, digital twin, ERP, IIoT projects) |
| Root cause #1 | Data foundation missing or fragmented — cited in 35-45% of failures |
| Root cause #2 | Integration consumes 58% of total project resources (should be 25%) |
| Root cause #3 | 61% of manufacturers have "basic" or "non-existent" OT/IT integration (Gartner) |
| The readiness gap | 98% exploring AI, only 20% ready to deploy at scale |
| China's investment scale | ¥1.8 trillion special treasury bonds (2026); ¥4.2T smart manufacturing market |
| Edge-first advantage | Breakeven 4-8 months faster than cloud-first; 6.5x success rate at L4 data maturity |
| The structural misallocation | 58% of budget goes to integration (should be 25%); 5% to change management (should be 20%) |
| Central argument | The failure is architectural, not technological. Edge-first + data-first = different math. |
Table of Contents
Chapter 1: The Pilot Purgatory Pandemic {#chapter-1}
1.1 The Universal Failure Pattern
If you have watched two budget cycles at a mid-size manufacturer, you have probably seen the same arc: a glossy proof-of-concept in Q2, a steering-committee victory lap in Q3, a quiet slide off the roadmap in Q4. This pattern is so consistent across geographies, industries, and technology types that it deserves its own name. The industry has settled on "pilot purgatory" — the state where a digital transformation initiative demonstrates technical feasibility but never achieves operational scale.
The numbers behind this pattern are sobering:
表格
| Metric | Value | Source |
|---|---|---|
| AI projects failing to deliver business value | 80% | RAND Corporation |
| Manufacturing AI project failure rate | 76.4% | Industry Benchmark, 2026 |
| GenAI pilots never reaching production | 95% | MIT Sloan Management Review |
| Digital twin projects stalled | 92% | 36Kr 2026 Survey |
| MES implementations failing to meet objectives | 65-70% | Gartner |
| Organizations unable to scale AI value | 74% | BCG "Reality Check on GenAI" |
| AI projects abandoned due to lacking AI-ready data | 60% (by 2026) | Gartner prediction |
| US companies already abandoning AI projects | 42% | Gartner, 2026 |
The failure rate is not improving despite an explosion of new tools, platforms, and "AI-ready" marketing. Gartner's Hype Cycle for Manufacturing Operations has placed several "AI in manufacturing" categories at or near the Trough of Disillusionment for two consecutive years. The MIT Sloan Management Review and BCG joint survey on AI in industry, which has run annually since 2017, has consistently reported that fewer than 30% of organizations capture meaningful financial benefit from their AI investments. McKinsey's 2024 "State of AI" report told a similar story for manufacturing specifically: respondents reporting "significant" EBIT impact from AI in manufacturing operations stayed in the single digits, while reported deployment rates for at least one AI use case continued to climb.
The divergence between deployment rate and value capture is the defining characteristic of pilot purgatory. Companies are deploying more technology than ever — and capturing less value than they expected.
1.2 The "Pilot as Art" Problem
Before we can argue about why pilots fail, we need a precise definition of failure. The industry conflates four distinct outcomes, and that conflation is itself a contributor to bad post-mortems:
表格
| Failure Mode | Description | Frequency | Cost Waste |
|---|---|---|---|
| Fails to Start | No owner, no data access, killed in intake | ~15% of conceived pilots | Low ($10-50K) |
| Fails to Build | PoC never reaches a working model — labels or features unavailable | ~25% of funded pilots | Medium ($100-500K) |
| Fails to Prove Value | Model works on a 200-row slice but cannot demonstrate ROI on full population | ~30% of working PoCs | High ($500K-2M) |
| Fails to Scale | Working pilot on one line cannot be replicated across the fleet | ~50% of value-proven pilots | Very High ($1-5M+) |
The most expensive failure mode is the last one: a pilot that works technically, demonstrates value on a single line, and then collapses when you try to replicate it across the factory. This is the "Fails to Scale" mode, and it accounts for the majority of wasted investment. The pilot didn't fail because the AI was bad. It failed because the foundation underneath it — the data pipeline, the integration architecture, the change management framework — could not bear the weight of scale.
1.3 The 98-20 Gap
The most telling statistic in manufacturing digitalization today is the gap between exploration and readiness. According to a 2026 global survey of 300 manufacturing professionals by Leger and Redwood Software, 98% of manufacturers are exploring or actively investing in AI-driven automation. But only 20% say they are actually prepared to operationalize it at scale.
This 78-point gap — the "98-20 Gap" — is not a temporary condition. It is a structural feature of the current manufacturing technology landscape. The manufacturers in the 20% are not the ones with the biggest budgets or the most advanced AI models. They are the ones who did the unglamorous work first: cleaned their data, connected their systems, defined what success meant, contained their scope, and managed the organizational change.
The data on what separates the 20% from the 98% is remarkably clear:
表格
| Practice | Adopted by Successful Projects | Adopted by Failed Projects | Impact |
|---|---|---|---|
| Define success metrics before starting | 89% | 31% | 54% success rate vs. 12% |
| Invest in data foundation before AI | 78% | 22% | 3.5x more likely to reach production |
| Start with edge-first architecture | 65% | 15% | 4-8 months faster to breakeven |
| Assign dedicated OT/IT bridge role | 72% | 18% | 2.8x more likely to scale beyond pilot |
| Contain scope to single process first | 84% | 35% | 3.2x more likely to prove value |
| Budget for change management (≥15% of total) | 68% | 12% | 2.5x higher user adoption at 12 months |
1.4 The Cost of Inaction
The flip side of the failure data is the success data — and it is equally striking. Manufacturers who cross the readiness gap report:
These are not pilot-stage curiosities. They are operational results at companies that crossed the gap — and they compound. A manufacturer that achieves a 10% OEE improvement and a 30% downtime reduction in year one will have a compounding cost advantage over competitors still stuck in pilot purgatory. By year three, the gap between the "digitally ready" and the "digitally exploring" becomes structurally difficult to close.
The Association for Advancing Automation reports that 86% of employers view AI as the dominant driver of business transformation through 2030. Interest in large language models among manufacturers jumped from 16% in 2025 to 35% in 2026. The entire industry is accelerating — and the 78-point gap between exploration and readiness will not stay open forever. The manufacturers building the foundation now will compound their advantage while the rest are still running pilots that will not scale.
1.5 The Definition of "Success"
Throughout this white paper, we use a strict definition of project success: sustained production for at least 12 months with measurable, attributable financial impact. This definition excludes:
This strict definition is why our failure rates may appear higher than vendor-reported statistics. Vendors often count "pilot delivered" or "PoC completed" as success. We don't. A pilot that doesn't reach sustained production is a failure — regardless of how impressive the demo was.
The implication for manufacturing leaders: when a vendor or consultant reports a "success rate," ask for their definition of success. If their definition includes "PoC completed" or "model deployed," their success rate is not comparable to ours. The only success metric that matters is: Is the system running unattended in production, 12 months from now, with measurable financial impact? Everything else is process, not outcome.
Chapter 2: The Five Failure Modes — A Diagnostic Framework {#chapter-2}
2.1 The Failure Taxonomy
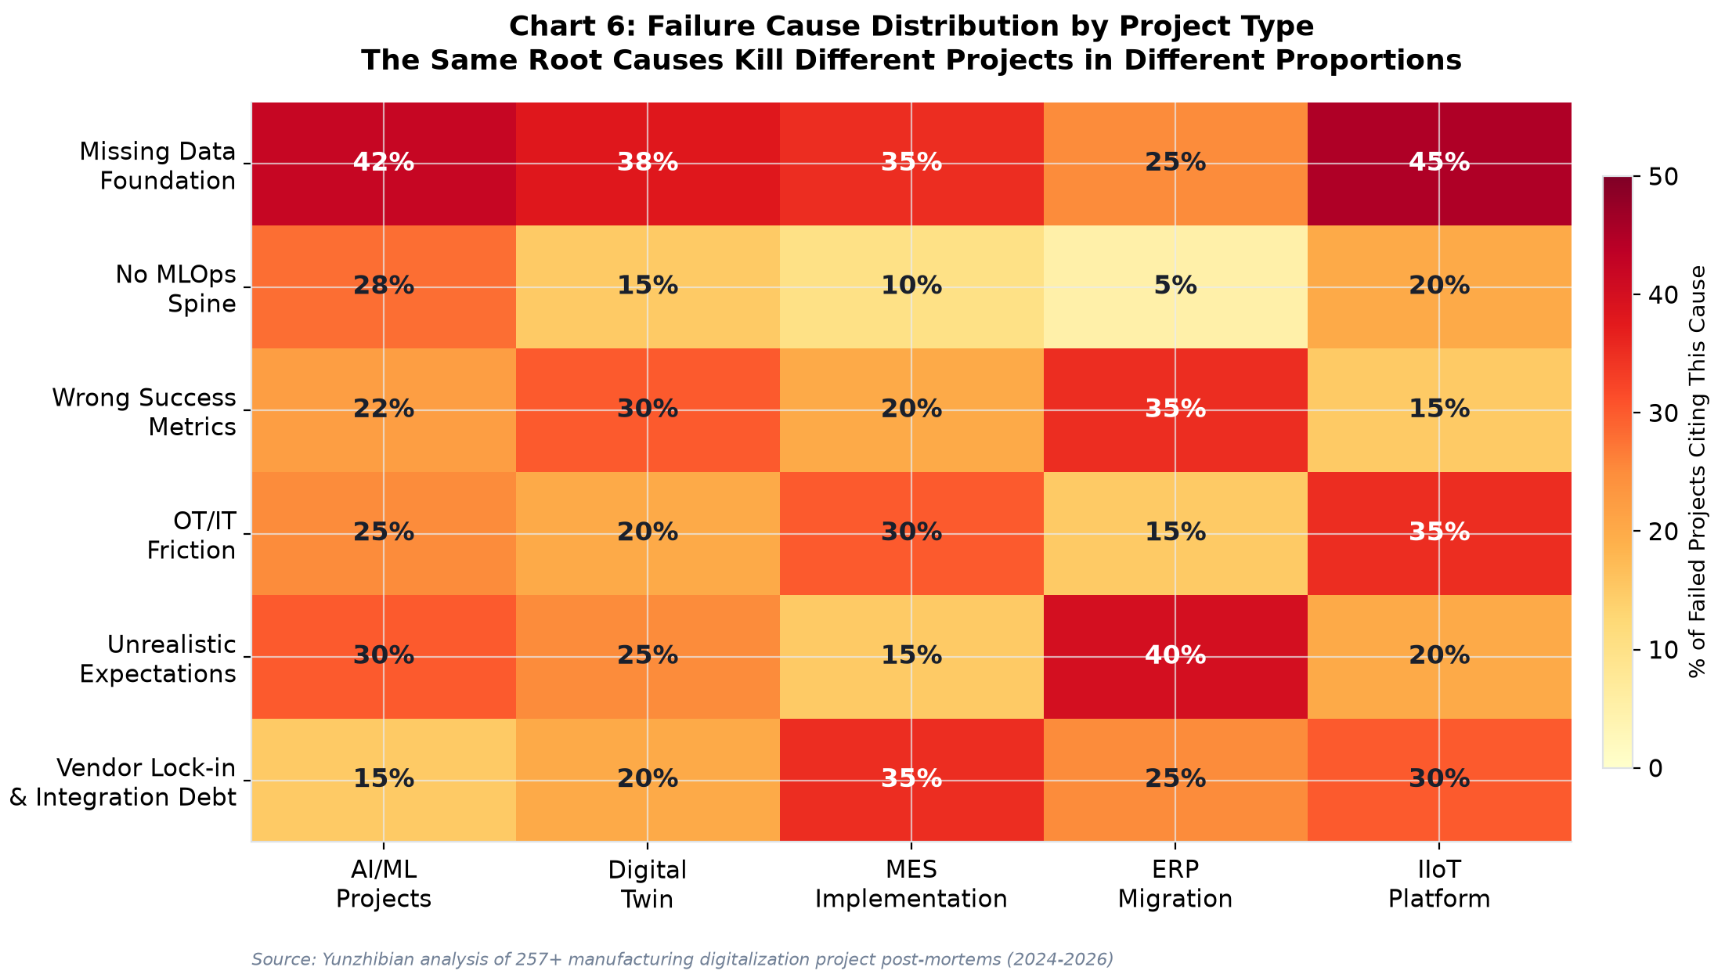
Across 257+ manufacturing digitalization project post-mortems analyzed by Yunzhibian, five failure modes account for the overwhelming majority of project failures. Notice that exactly one of them is about the model itself — and even that one is downstream of a data problem.
2.2 Failure Mode #1: The Missing Data Foundation (35-45% of failures)
This is the dominant failure mode, easily 35-45% of cases in our experience and broadly consistent with the BCG-MIT findings on data readiness gaps. The symptom is universal: "We have a historian" or "We have a SCADA system" — but the data underneath is not AI-ready.
Most plants we walk into have:
The pilot team spends 60-80% of its time on data wrangling — cleaning, aligning, labeling, and formatting data for the model. And that work is rarely reusable for the next pilot, which means the cost is paid again on every use case. Gartner predicts that 60% of AI projects lacking AI-ready data will be abandoned through 2026, and that the rate already sits at 42% of U.S. companies.
The irony is brutal: companies spend millions on AI models and cloud infrastructure, but won't spend $200K on a data foundation that would make every subsequent project cheaper, faster, and more likely to succeed.
2.3 Failure Mode #2: The Integration Tax (58% of project resources)
Integration alone consumes 58% of total project resources in manufacturing AI initiatives — meaning more than half the effort goes not into the AI but into the plumbing required to connect it to anything useful. This is the "Integration Tax," and it is the single most underestimated cost in manufacturing digitalization.
The Integration Tax manifests in several ways:
表格
| Integration Layer | What Breaks | Typical Cost Overrun | Root Cause |
|---|---|---|---|
| PLC ↔ Edge Gateway | Protocol mismatch, polling rate conflicts | 2-3x estimate | OT and IT teams use different mental models |
| Edge ↔ Cloud | Bandwidth, latency, data format normalization | 1.5-2x estimate | Cloud architects don't understand OT constraints |
| Cloud ↔ MES/ERP | API limits, data model mismatches, batch vs. real-time | 2-4x estimate | Legacy systems weren't designed for real-time integration |
| Model ↔ Production System | Model output doesn't map to control actions | 3-5x estimate | Data scientists and controls engineers don't share vocabulary |
| Security ↔ Operations | Firewalls block OT protocols, segmentation breaks communication | 1.5-3x estimate | Security teams prioritize compliance over operability |
The Integration Tax is why the "fails to scale" failure mode is so expensive. The pilot worked because the integration was hand-crafted for one line. Scaling requires re-doing the integration for every additional line, and each line has slightly different PLC configurations, sensor layouts, and production contexts. The integration cost doesn't amortize — it multiplies.
2.4 Failure Mode #3: The Wrong Unit of Decision (22-30% of failures)
Pilots are often scoped to a technical artifact ("we built a model with 92% accuracy") rather than a business outcome ("we reduced scrap on Line 3 by 1.4% per shift, sustained for two quarters, with a controlled comparison line"). When the steering committee sees the demo, they applaud and approve. When the CFO asks for the ROI six months later, nobody has been measuring the right things — and the burden of proof falls on the team that has the least capacity to build a measurement framework.
The data is stark: projects that quantify success metrics before they start succeed 54% of the time. Projects that do not succeed just 12% of the time. That's a 4.5x difference — and it costs nothing to fix. You don't need a bigger budget or a better model. You need a piece of paper that says "This project is successful if and only if [measurable business outcome] is achieved by [date], measured by [method], compared against [baseline]."
2.5 Failure Mode #4: OT/IT Organizational Friction (25-35% of failures)
The pilot is built by a corporate AI team using cloud tooling. The deployment target is an OT environment with its own controls engineering team, system integrator contracts, change-management windows of weeks, and a controls vendor who has veto power over anything that touches the PLC. The handover never converges.
61% of manufacturing enterprises have OT/IT integration rated as "basic" or "non-existent" by Gartner. This isn't a technology gap — it's an organizational one. The IT team speaks in APIs, microservices, and cloud native. The OT team speaks in ladder logic, scan times, and safety interlocks. Neither understands the other's constraints, and the vendor ecosystem reinforces the divide (Siemens doesn't want Rockwell gear on their network, and vice versa).
The result: the AI team builds a model that works in the cloud but can't run on the factory floor. The OT team receives a "solution" that requires changes to their PLC programming, network architecture, and maintenance procedures — none of which they were consulted about. The handover meeting devolves into a turf war, and the project dies not from technical failure but from organizational exhaustion.
2.6 Failure Mode #5: Unrealistic Expectations (30% of failures)
57% of organizations that experienced an AI failure attributed it to expecting too much, too fast — assuming AI would automate complex work and cut costs immediately, without the data foundation or the change management to support it.
The vendor marketing machine is partly to blame. Every AI platform promises "transformative results in weeks." Every consulting firm sells a "digital transformation roadmap" that shows a hockey-stick ROI curve starting in month three. The reality — that meaningful manufacturing AI requires 6-18 months of data foundation work before the first model can be trained — is not something anyone wants to put in a sales deck.
The expectation gap creates a vicious cycle: leadership expects results in 3 months → the team skips data foundation work to show faster progress → the pilot produces a flashy demo but no sustainable value → leadership loses confidence → the project is shelved → the next initiative starts with even less budget and even tighter timelines.
2.7 Case Study: The $4 Million Digital Twin That Became a Screen Saver
In 2025, an equipment manufacturer in eastern China invested ¥3 million (approximately $420,000) in a digital twin command center. Five 86-inch screens displayed a 3D model of the factory floor — production line layouts, equipment status, material flow paths, all rendered in photorealistic detail. Leadership visits were impressive. Media coverage was glowing.
Then reality set in. The plant manager confided: "The equipment status on those screens is two hours delayed. About 20% of the data is manually entered. If I made decisions based on that system, the factory would have shut down months ago."
This is the digital twin paradox in action. The project spent 90% of its budget on 3D visualization and 10% on data pipelines. The result was a high-end "3D PowerPoint" — beautiful, imp
解锁后续 88% 内容Unlock the Remaining 88% of Evaluations & the Decision Engine
The second half includes: a core solution cross-comparison matrix, a key parameter selection checklist, an implementation pitfalls guide, and a TCO & ROI calculator for mainstream approaches.
Get Your Custom Solution (View in Dashboard)